Once the initial values (and optionally parameter constraints) have been set, select Calculate->Fit Optical Properties to Measured Data to perform the fit. A new widget will appear indicating the progress of the fit with each iteration.
Once the calculation is completed, the results will be saved to an IMD file automatically, unless you have disabled this feature in the File->Preferences->Auto-Save... menu option.
Note: You can choose to save the measured data along with the calculation by selecting this option in the File->Preferences->Auto Save... menu option.
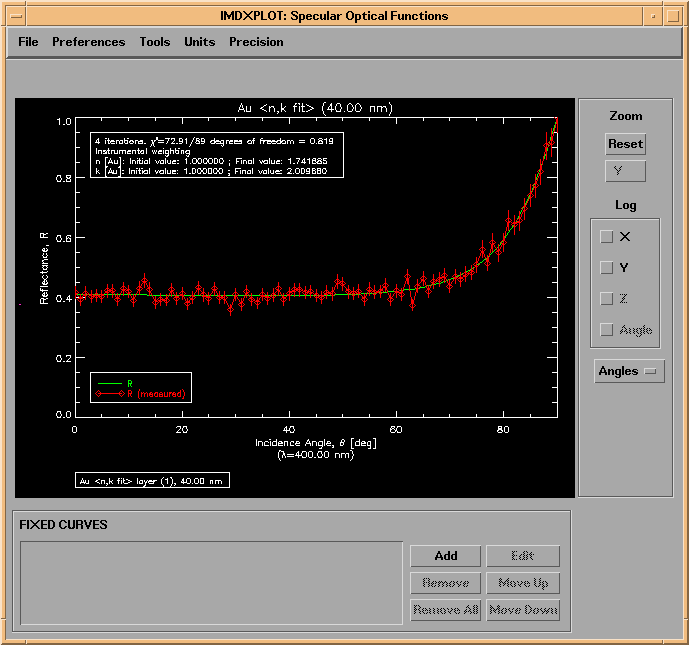
The results of our example are shown in Figure 3.3.1. The fit results are listed on the plot, showing the number of iterations, the final Chi^2 value, and the initial and final values of the fit parameters. The fit results are also indicated on the FIT PARAMETERS section of the main IMD widget, and the individual Fit Parameters widgets are updated to show the final fit parameter values as well.
Figure 3.3.1 Fit results.
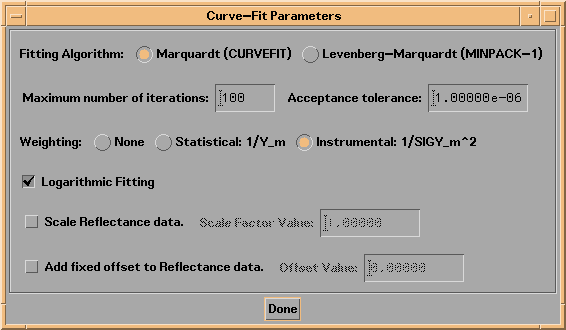
There are several other parameters that you can adjust on the Curve-Fit Parameters widget which affect how the fit is performed. This widget is shown in Figure 3.3.2, and is accessible by pressing the Curve-Fit Parameters... button in the FIT PARAMETERS section of the main IMD widget.
Figure 3.3.2. The Curve-Fit Parameters widget.
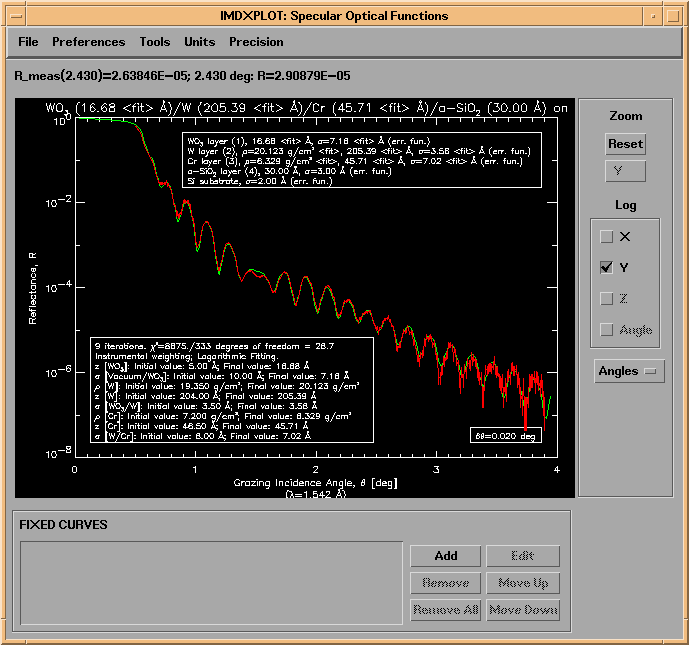
The results of a more complicated fitting example are shown in Figure 3.3.3. In this case, the X-ray reflectance of a W/Cr bilayer film was fit, using eight fit parameters. (The IMD file used to produce this plot is called examples.dir/WCr_bilayer.FIT.imd; the measured data file is called examples.dir/WCr_bilayer.MEASURED.dat.)
Figure 3.3.3. Fit to X-ray reflectance data of a W/Cr bilayer film